04 Monitoring
Workshop source
Workshop material is maintained in the public langfuse/langfuse-workshop repository. Use the repository for the runnable app, checkpoint branches, and local setup.
Starting point
git checkout checkpoint/04-monitoringYou have a traced app with optional Langfuse-managed prompts. Every chat turn lands in Langfuse as a nested trace.
If you want to use prompt management but have skipped module 3 run the following command to publish the prompt
npm run prompt:publishWhy monitor your AI app
In production, an AI app produces a lot of traces. Most of them are fine. The interesting ones — the answers that drift, the requests the agent shouldn't be handling at all, the patterns that change over time — are what you want to find. Monitoring is how you catch those signals without reading every single trace by hand.
For the bigger picture, see the Langfuse Academy lesson on monitoring.
Goal
The goal of monitoring is finding the things that are worth knowing about for your AI application. For Specs, we chose two events that are worth catching as a starting point:
- User disagreement — Dad pushes back ("No, that menu isn't there"). Either the agent gave the wrong steps or the app is showing its limits.
- All-caps frustration — Dad writes something like "THIS STILL ISNT WORKING". Not every all-caps message is anger, but it is a cheap deterministic signal that a conversation may need extra attention.
Monitoring also has a quality-tracking dimension — average score on some metric over time. We recommend signal detection first: tracking aggregate quality is most useful once you and your team have a clear opinion about what quality even means in your context, and the fastest way to form that opinion is to look at the surprising traces.
You don't need to change any code in this step. The trace shape from 02-tracing already has everything these monitors need: the agent observation has the full conversation and final answer, and each OpenAI generation has the system prompt plus the same message array.
Step 0 — Configure the Langfuse evaluator model
The first two monitors in this chapter use LLM-as-a-judge templates. Langfuse runs those judge calls from an LLM Connection inside your Langfuse project, so configure the evaluator model now, right before you use them.
If your project already has a default evaluator model, keep it and continue to Step 1.
- In Langfuse, open Project Settings → LLM Connections.
- Click Add new LLM Connection.
- Choose OpenAI, name the connection, and paste your OpenAI API key into the secret field.
- Save the connection.
- The default evaluation model is set during evaluator creation: if the project doesn't have one yet, the Set up evaluator wizard asks for it at its Set up LLM connection step before you can continue. When that appears, choose the OpenAI connection and a structured-output-capable model such as openai / gpt-4.1, then save. Once set, it shows as Default model at the top of the Evaluators page, where you can also change it later.
Keep the API key in the Langfuse secret field only. Do not paste it into workshop transcripts or shared notes.
Step 1 — Wire the first two judge-based monitors (Langfuse UI)
Langfuse ships published templates for User Disagreement and Out-of-Scope Request. Both are LLM-as-a-judge evaluators that read variables from observations. The two templates need slightly different targets:
- User Disagreement needs the conversation history, so target the root
dad-it-support-chat-turnagent observation. - Out-of-Scope Request needs the system prompt, so target the final OpenAI generation. Only the generation input carries the system message; the agent input is the chat request from the browser, which holds Dad's messages alone.
For User Disagreement:
-
In Langfuse, open Evaluators → New Evaluator and pick Detect User Disagreement from the Template Gallery.
-
On the right side, select the trace root as a sample observation, this will likely be preselected. We are targeting the root observation of type Agent, the place where the overall trace input and output is logged.
 Hint: If you hover over the filters in the filter bar, you will see what each of those filter out. You can also 'Ask AI' to configure your filters.
 -
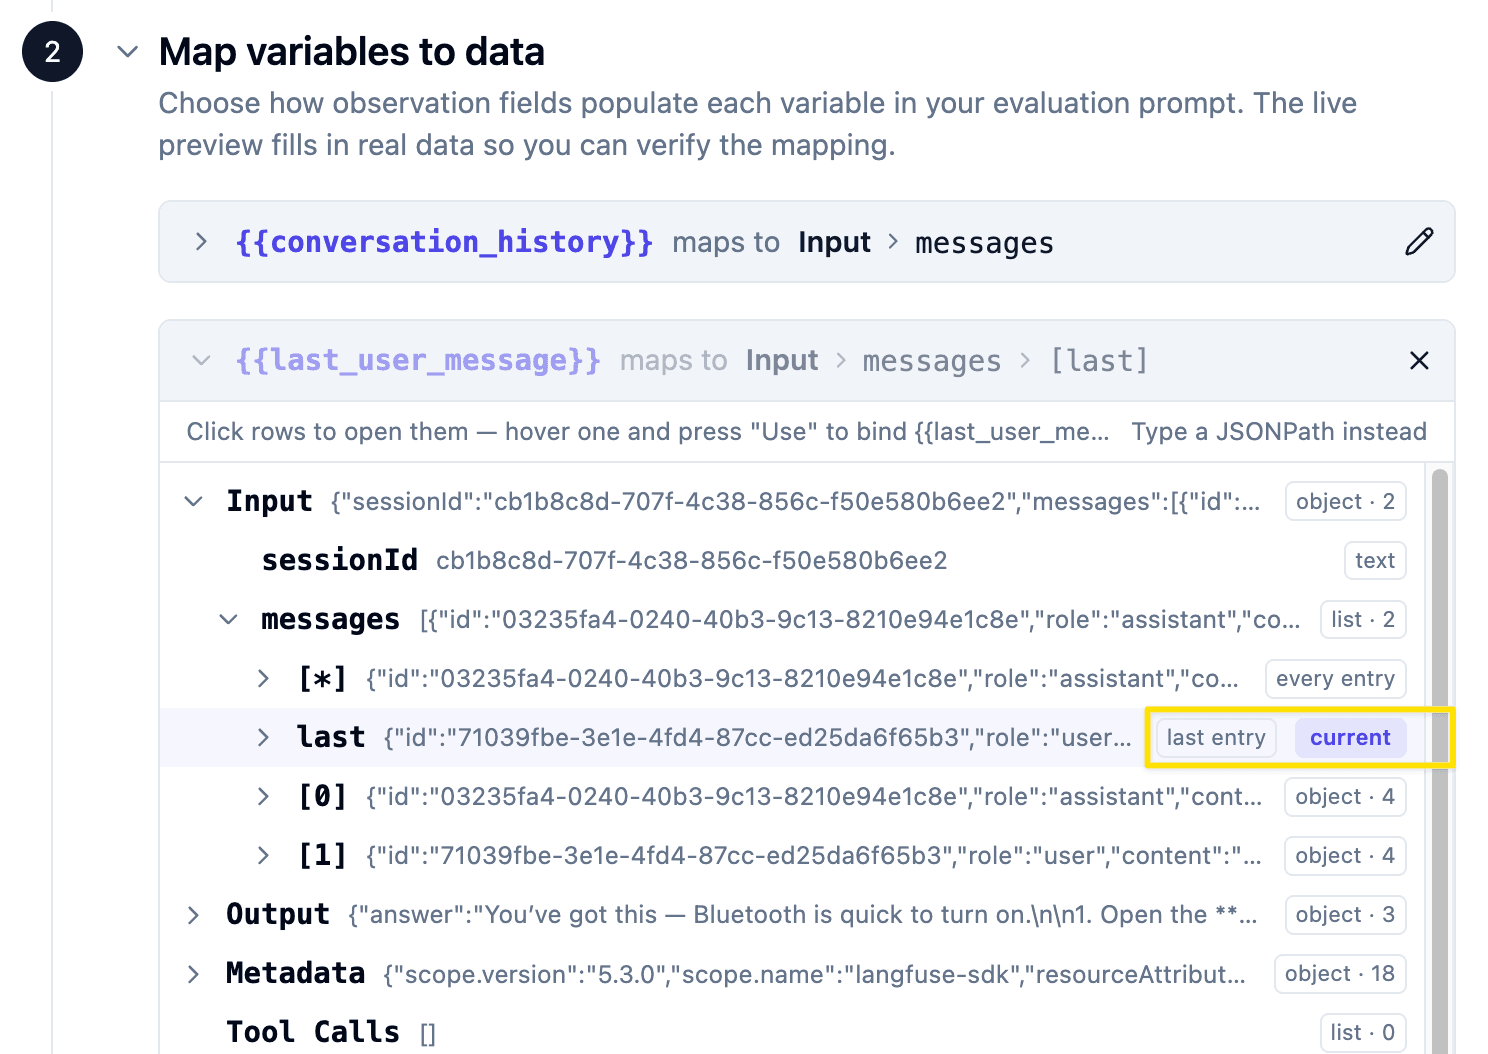
Map the template's variables from the agent observation's Input through the UI selector:
Template variable Object field JsonMapping {{conversation_history}}InputAll messages {{last_user_message}}InputLast message 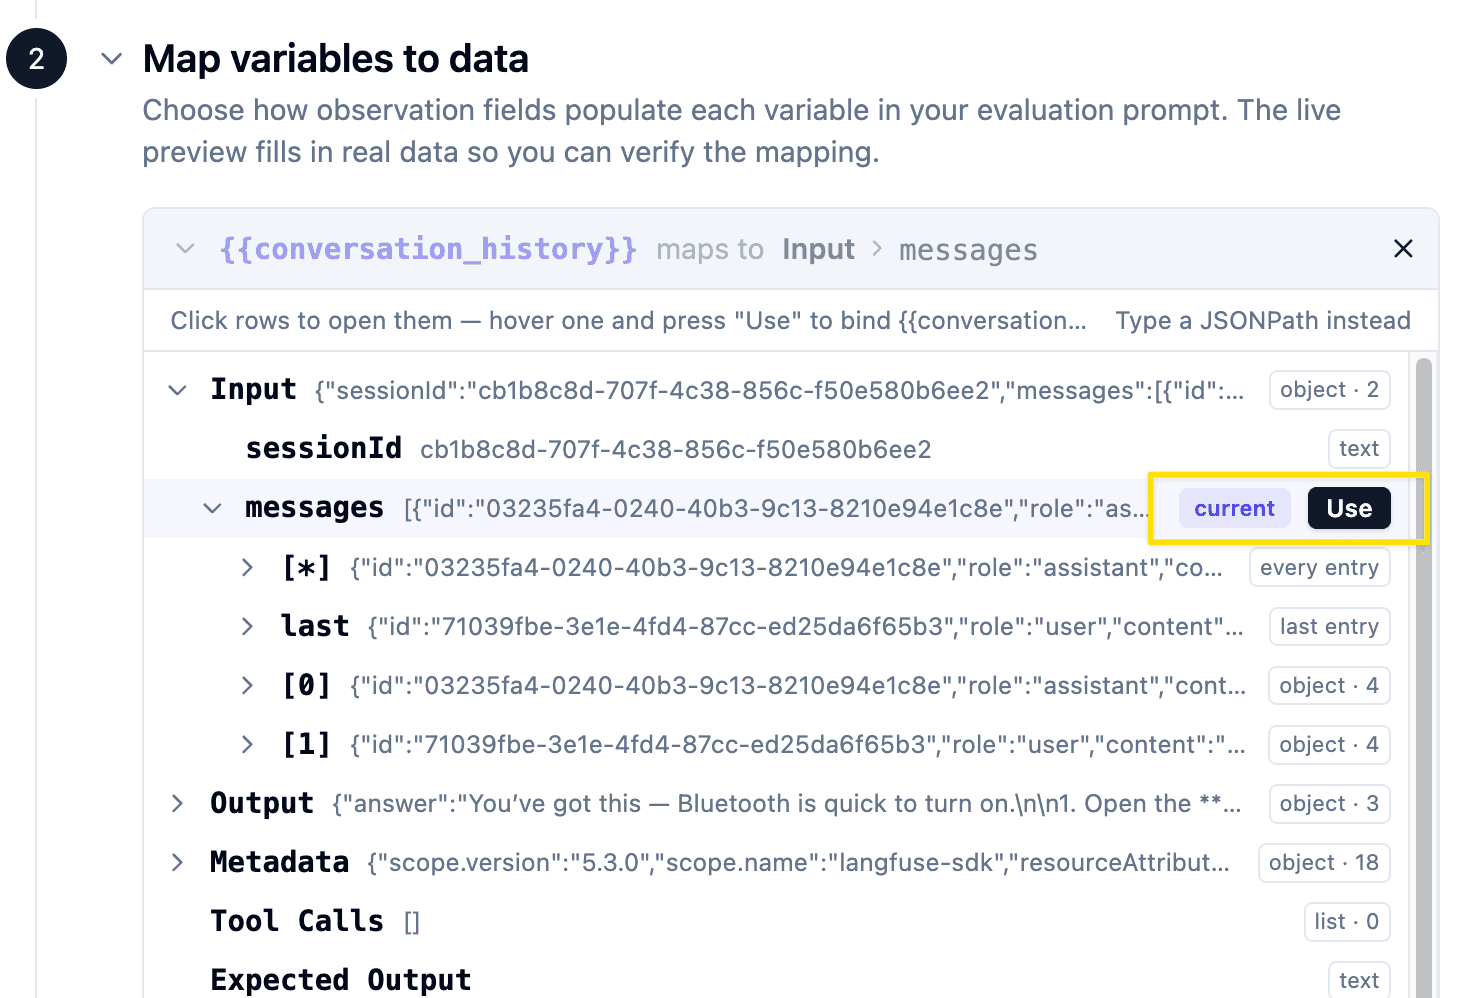
-
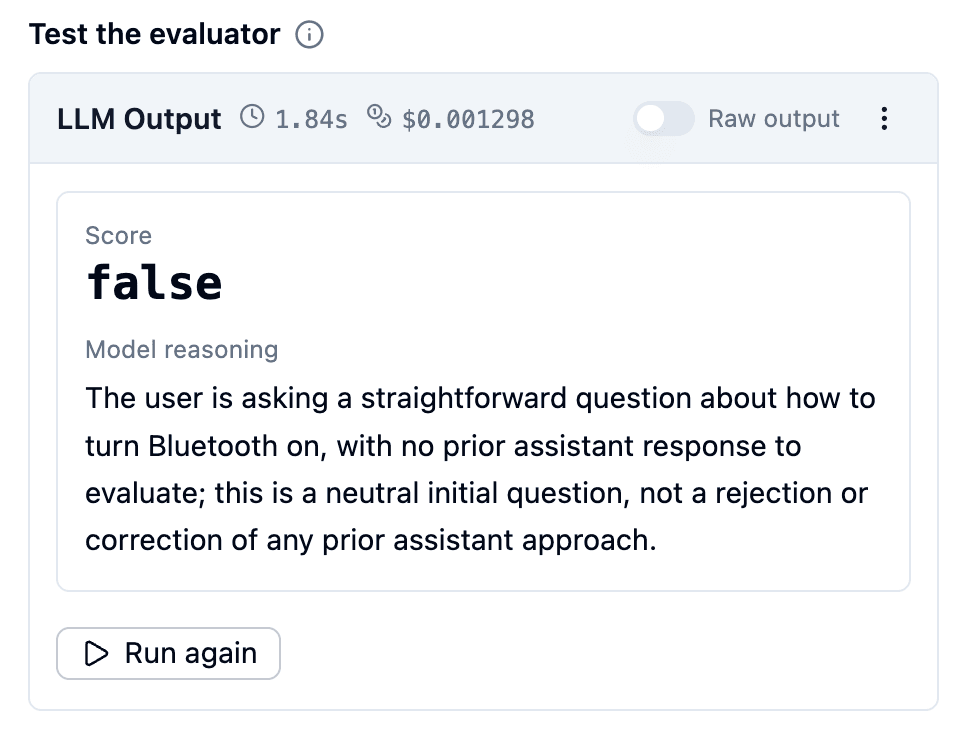
In the right panel, you can test run your evaluator on a sample observation
-
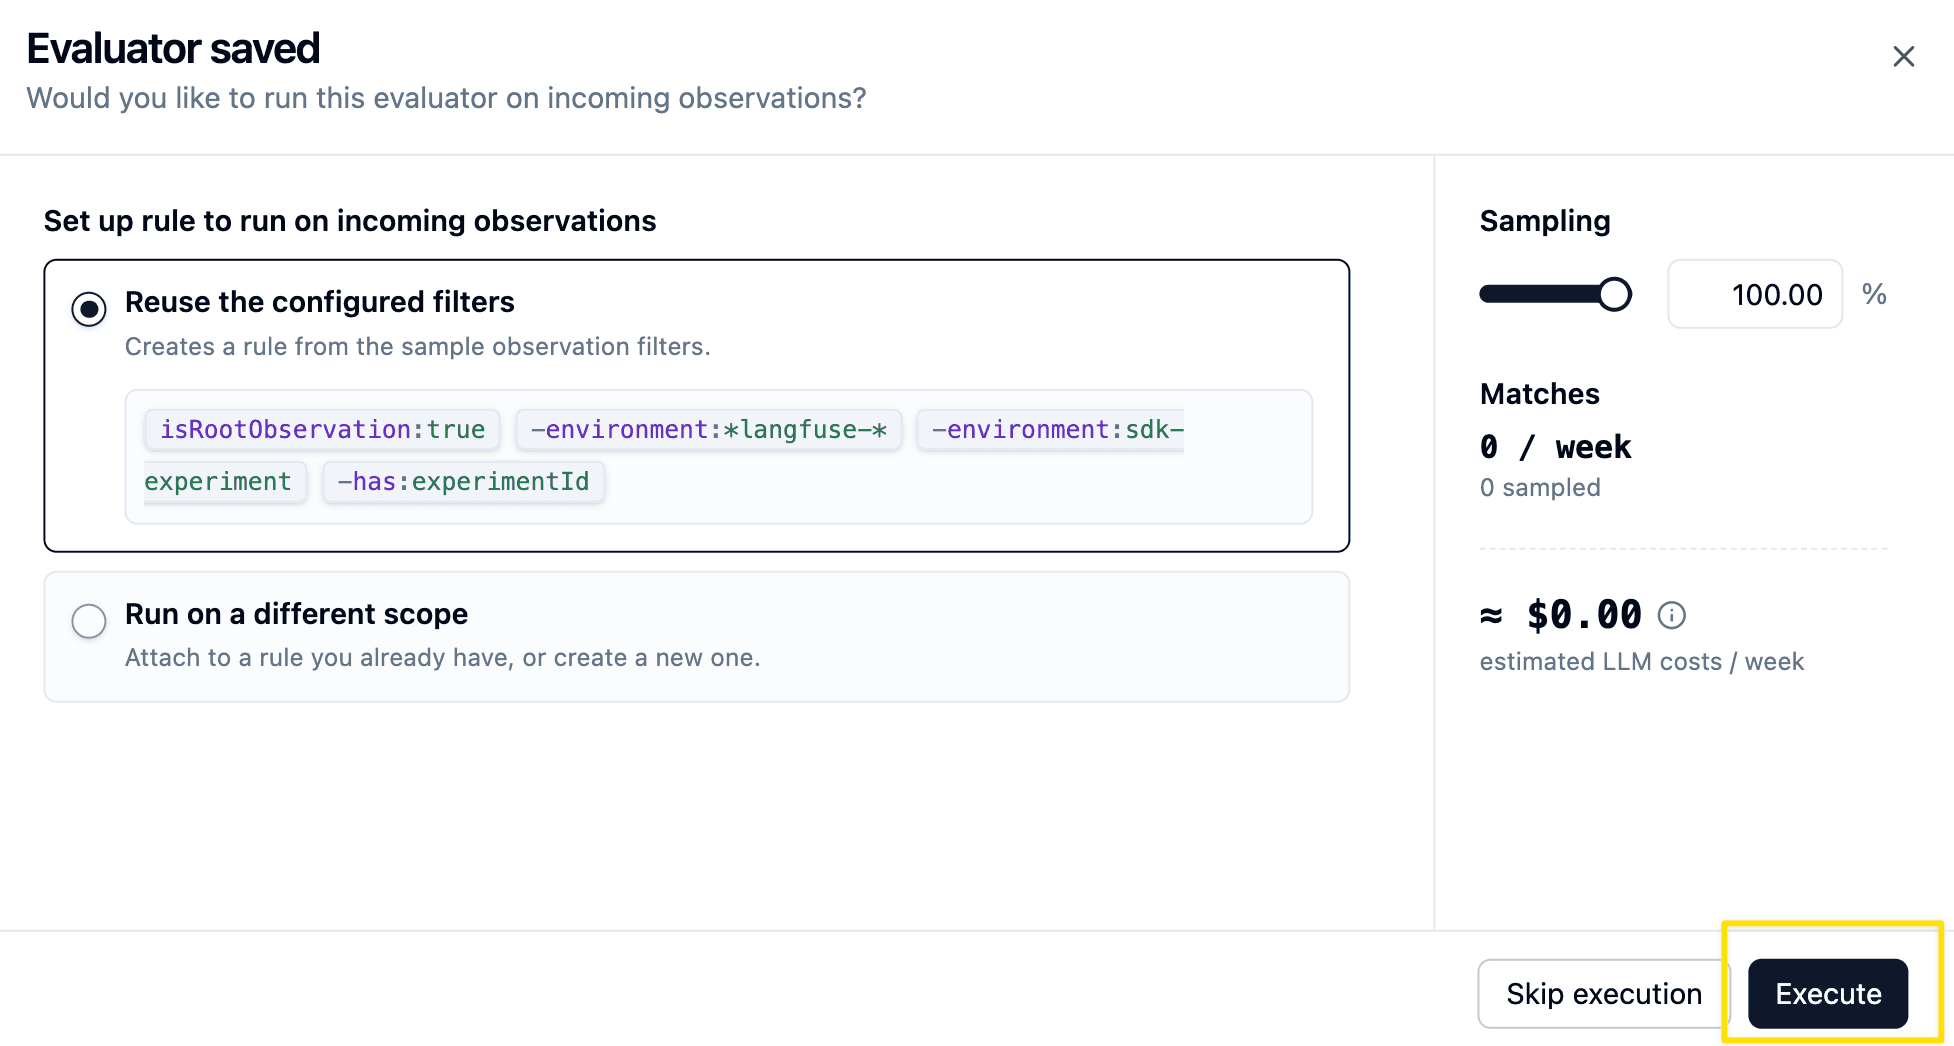
Finally click on Create evaluator. In the upcoming screen you can see a rough cost estimation per week and set a sampling rate. As soon as you click on execute, your first evaluator is running.
Step 2 — Add a code evaluator for all-caps frustration
The monitor above use LLM-as-a-judge because they need semantic judgment. This one does not. We just want a cheap deterministic check for a user message that contains a long run of capital letters, indicating a user might be upset from the interaction with our system.
Code evaluators are a good fit for that pattern: no model call, no prompt design, just a simple rule that runs on live observations.
-
In Langfuse, open Evaluators → New Evaluator and pick Detect User Frustration (ALL CAPS). In the view you can see a pre-configured code evaluator, that is targeting the Input of an observation and checks whether more than 70% of a message are all caps letters.
-
Target the same root agent observation as the disagreement monitor:
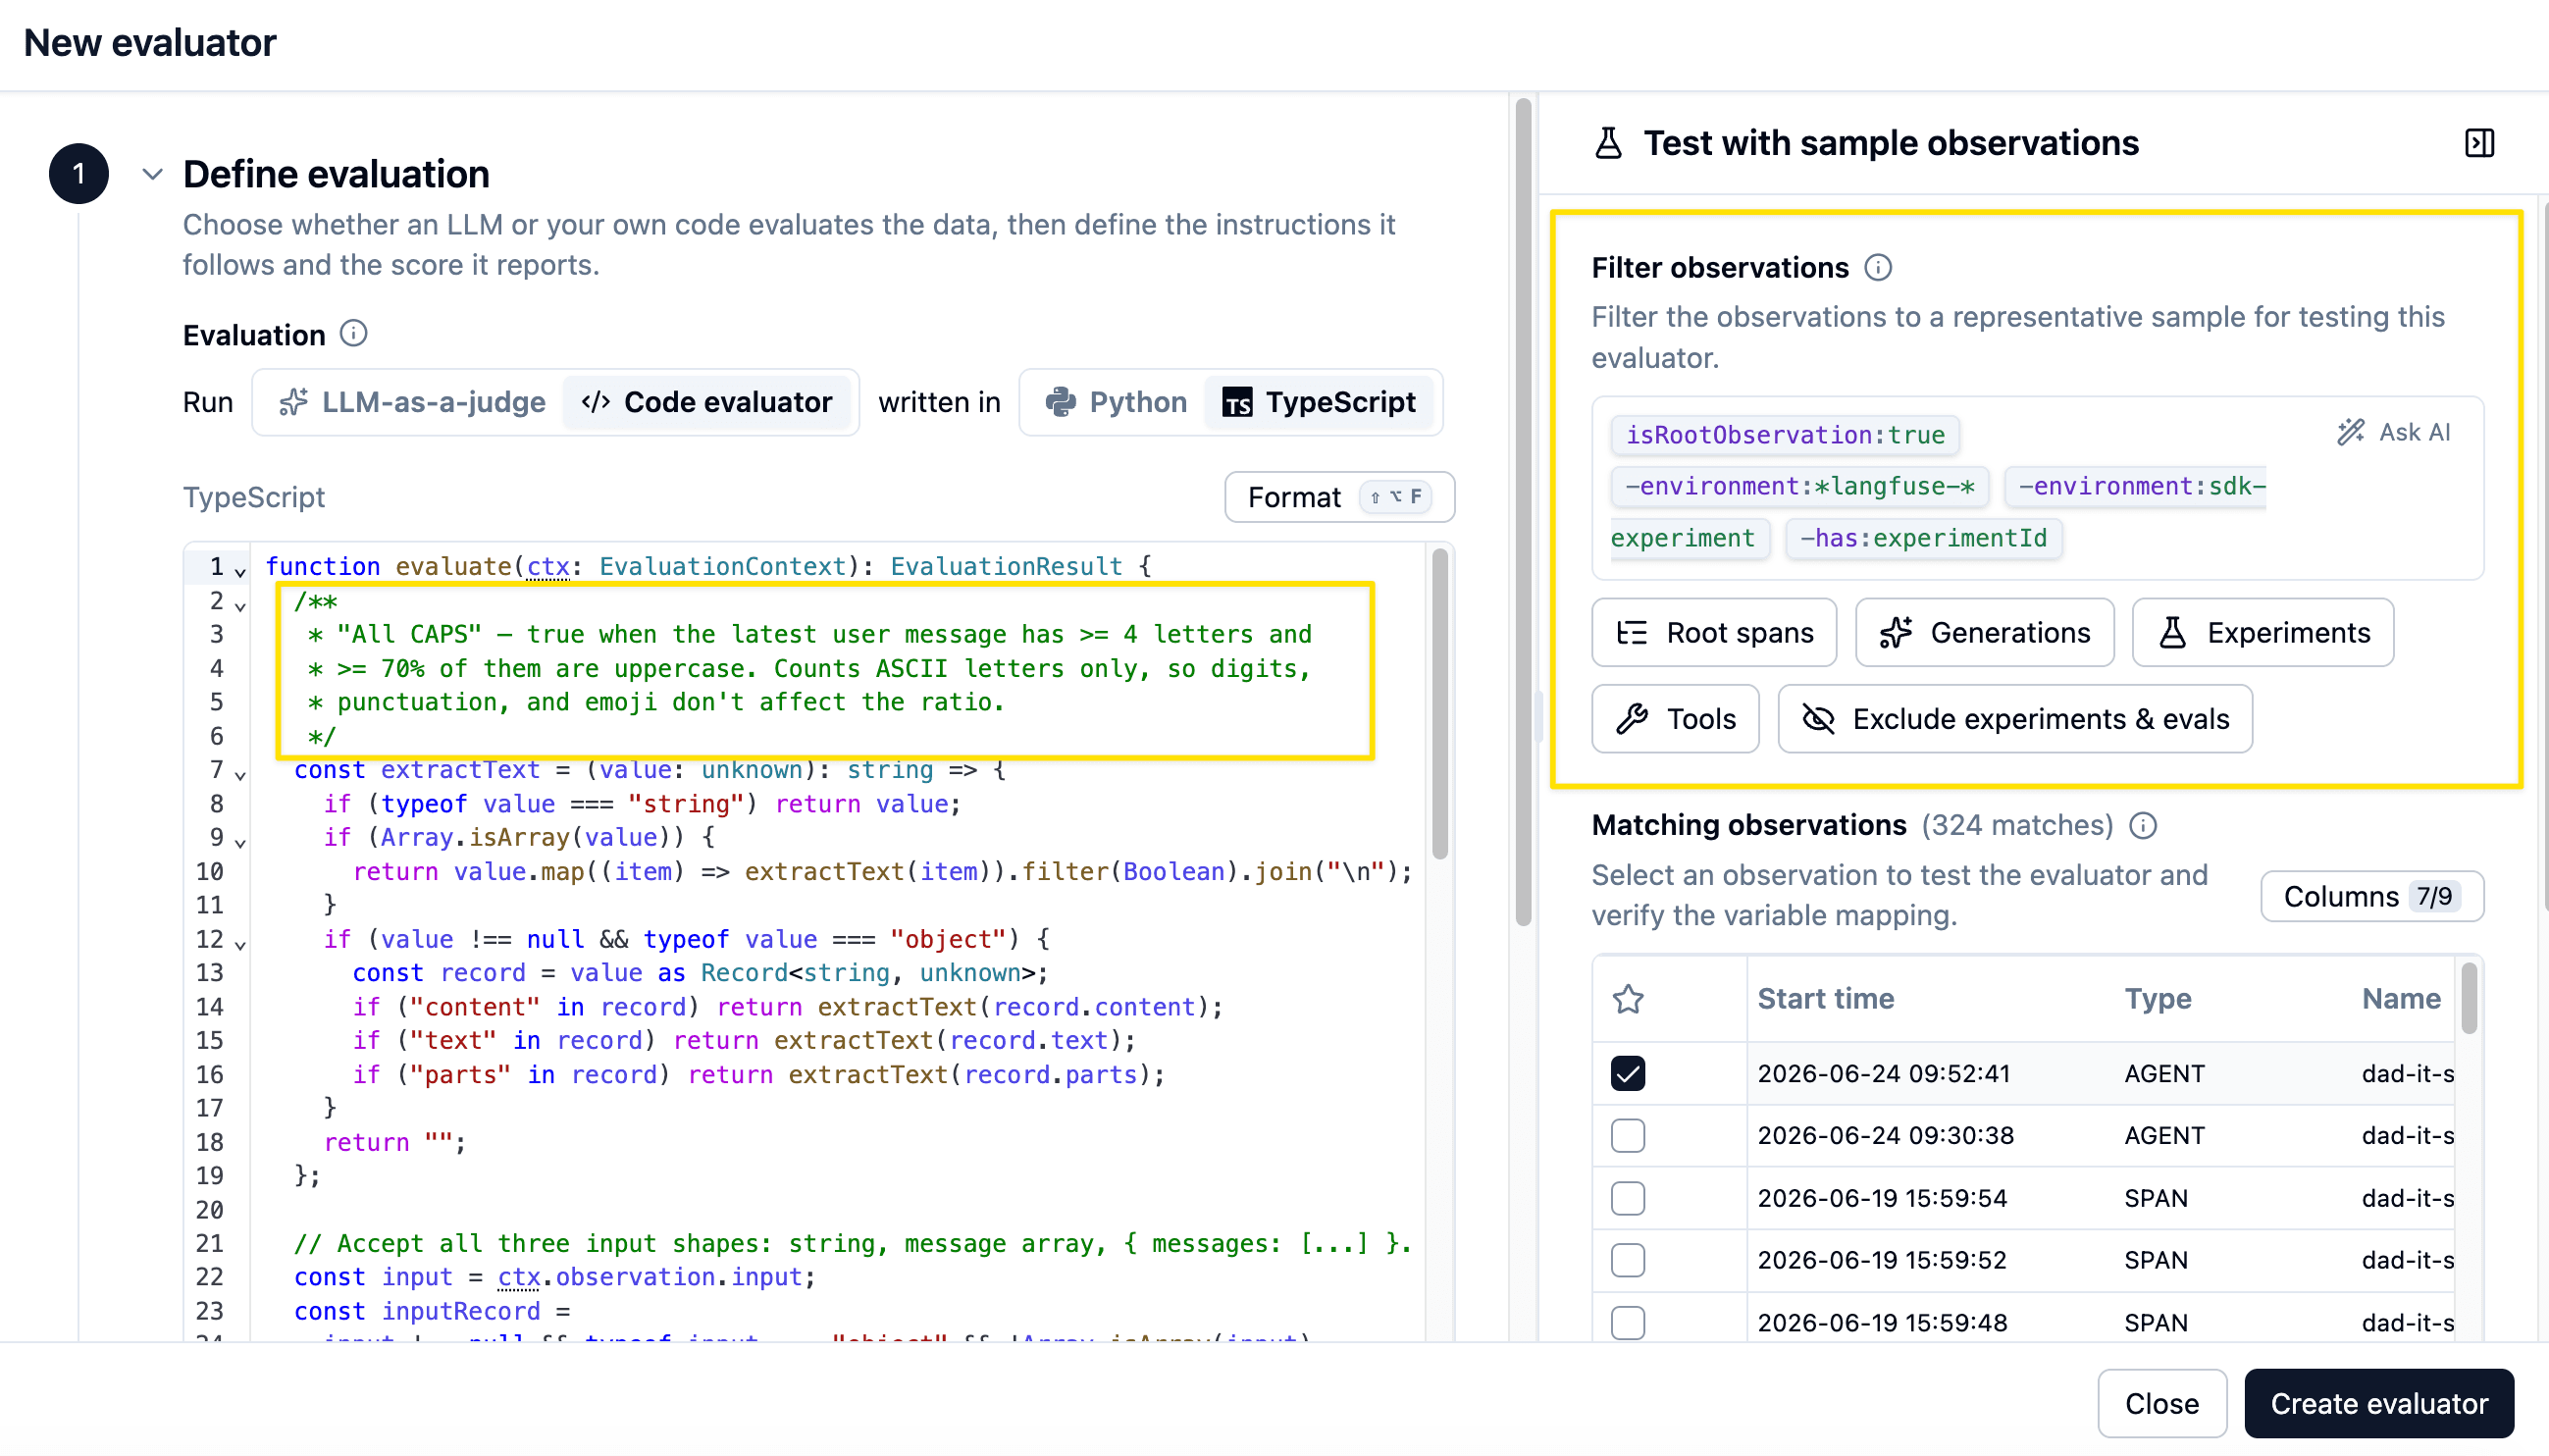
- Run a test on the evaluator.
- Click on Create Evaluator and then on execute.
This evaluator does not need the Langfuse evaluator model from Step 1, because it is pure Typescript code running inside Langfuse's sandbox rather than an LLM judge.
Verify
npm run devSend four turns that should each light up one monitor:
- Disagreement — ask a normal question, then reply with "No, that menu isn't there"
- All caps — "THIS STILL ISNT WORKING"
In Langfuse, wait for the evaluators to run (refresh after a few seconds), then sort traces by the evaluator scores. The out-of-scope, disagreement, and all-caps traces should bubble to the top.


User disagreement is a high-signal event. When a user pushes back on an answer the agent just gave, something almost certainly went wrong — wrong tool result, missing context, an instruction that doesn't match the iPhone they're on. These are the traces you want to read first, and they're prime candidates to turn into dataset items for 05-dataset.
The all-caps signal is intentionally rougher. It is not a claim that the user is definitely angry; it is just a cheap deterministic clue that the conversation might be going sideways. That makes it a good "review these first" monitor, especially when paired with the richer disagreement and out-of-scope judges.
Seed production traffic and watch the monitors fire
Four hand-typed turns prove the wiring works. But monitoring earns its keep on volume — so let's now seed a batch of realistic production data and look at what happens.
npm run langfuse:seed:otel:no-scoresThis replays a snapshot of real "Dad IT support" traffic — plus a handful of synthesized edge cases (out-of-scope asks, ALL-CAPS messages, and "no, that menu isn't there" disagreements) — into the production environment of your Langfuse project. It reuses the Langfuse keys already in your .env and shifts every timestamp so the newest trace lands at "now".
⚠️ The seed is not idempotent. OpenTelemetry mints fresh trace IDs on every run, so re-running doubles the data. Run it once; if you need a clean slate, delete the prior seed traces in Langfuse before seeding again.
Now open Tracing, filter to the production environment, and refresh after a few seconds. Watch the scores land across the seeded batch as the evaluators chew through it — all-caps, and disagreement edge cases bubbling up just like the turns you sent by hand, only at scale. That is what your monitors will look like against real traffic, and it is exactly the pile of flagged traces you will mine for the next chapter.
Wrap-up
Good monitors are how you separate signal from noise. Production means a lot of traces, and the most important question is which ones should I look at? — monitors answer that.
Once you have signal-Request monitors in place, the next step over time is average-metric tracking — picking quality metrics and watching them drift. The right way to choose those metrics is error analysis: look at a sample of the surprising traces you're now catching, group them by failure mode, and turn the failure modes into evaluators. The monitoring lesson on the Academy goes deeper on this.
The traces you catch with these monitors are also the best source for the next step — 05-dataset — because they're real examples of behavior you want to lock in or fix.
End state
This is the starting point for 05-dataset.